mf4361
Champion Member
- Apr 17, 2014
- 2,458
- 130
- Category........
- Job Offer........
- Pre-Assessed..
- App. Filed.......
- 18 Nov 2015
- Nomination.....
- 12 Oct 2015
- AOR Received.
- 25 Feb 2016
- IELTS Request
- Sent
- Med's Request
- 28 Oct 2016
- Med's Done....
- 14 Nov 2016
- Passport Req..
- 27 Feb 2017
- VISA ISSUED...
- 15 Mar 2017
- LANDED..........
- 16 Mar 2017
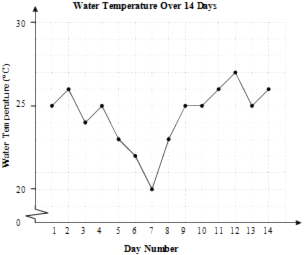
kryt0n said:Thats the same graph, just using a different starting y point.
and that is my point. put it in a different axis makes the actual increase in number smaller than advertised. Did anyone remember some high school statistics and graphing?
The previous graph is using graph to distort data to make an anecdotal point. @Que Em will be good at being a politician
")