Updated graphs:
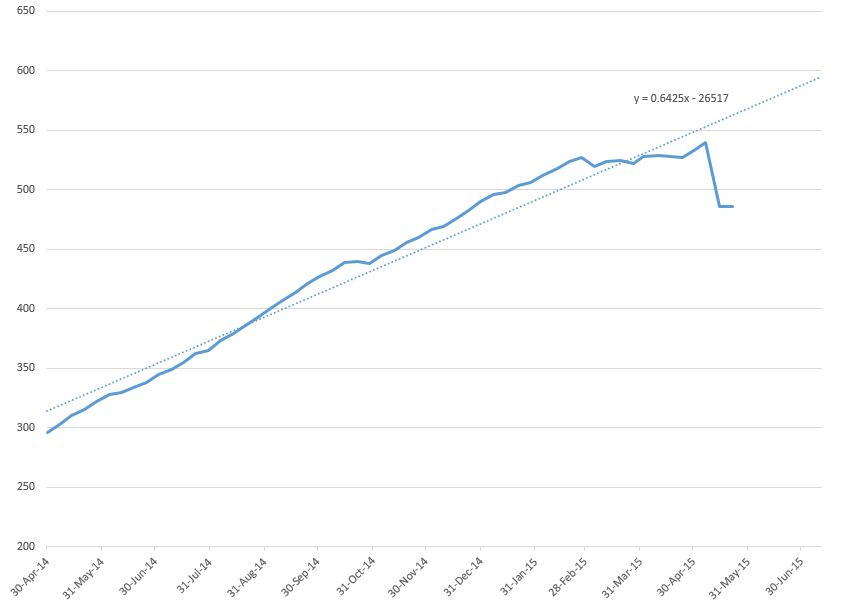
Graph showing that we have finally eliminated the backlog created in 2015, and are back in line with the processing times reported December 2014:
http://i14.photobucket.com/albums/a307/gpooj/2015-05-28%2011_31_31_zpsl9mdd45t.png
Still sad that we haven't eliminated any of the 2014 backlog yet, which is still pretty pathetic, they have a lot of catching up to do.
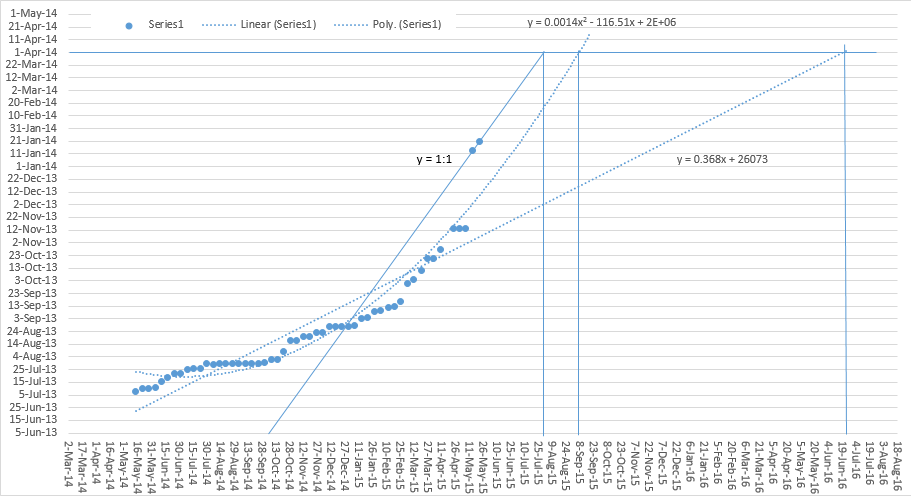
Graph showing the expected processing date of a person applying April 1, 2014:
http://i14.photobucket.com/albums/a307/gpooj/2015-05-28%2011_31_20_zps3tyow8pf.png
There are 3 trend lines now:
Linear fit over progress of the last full year, giving an expected AIP time somewhere around June 25, 2016.
Exponential fit over the last full year, showing steadily decreasing efficiency, giving an expected AIP time somewhere around September 8, 2015.
1:1 line, if CIC wasn't a circus, and they processed at the same rate time passes we would see this trend. This trend line intersects with reported data around December 2014, which means we're currently back in line with the expected processing time reported December 2014, instead of the disaster that ensued over the following months.
The 1:1 line shows an expected AIP time somewhere around August 1, 2015.
I'm going to simply shift the 1:1 line around with the website updates. So, if we get a notification that "February 15, 2014 is finally being processed at long last" I'll shift that line to intersect with that date.


